
Heart Rate Monitoring (PPG) (Preparatory School Project)
As part of my Personal Initiative Project (TIPE) completed during my two years in preparatory classes, I explored heart rate monitoring methods and their applications in preventing health incidents. This article presents in detail my research and experiments conducted as part of this project.
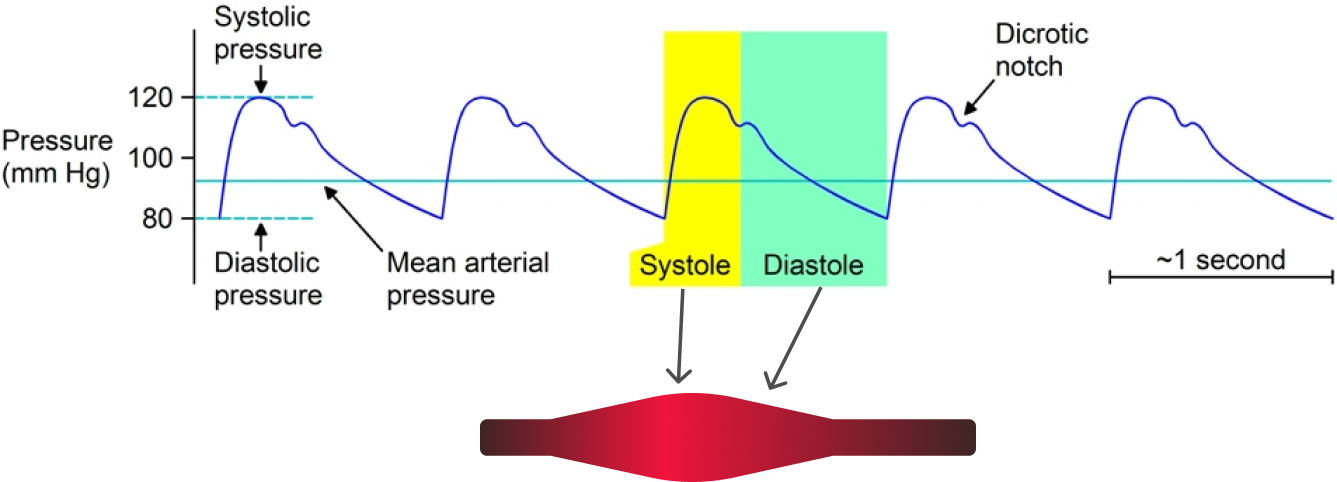
In this article, I will develop one of the methods for heart rate monitoring: photoplethysmography, often abbreviated as PPG. To understand how PPG works, it is essential to grasp what a heartbeat is and the effects it produces. With each beat, a blood flow propagates through the vessels, leading to an increase in blood volume and tissue thickening, followed by a decrease in volume due to blood reflux. The phase of volume increase is called systole, while the reflux phase is called diastole. Photoplethysmography uses this principle to measure variations in tissue opacity.
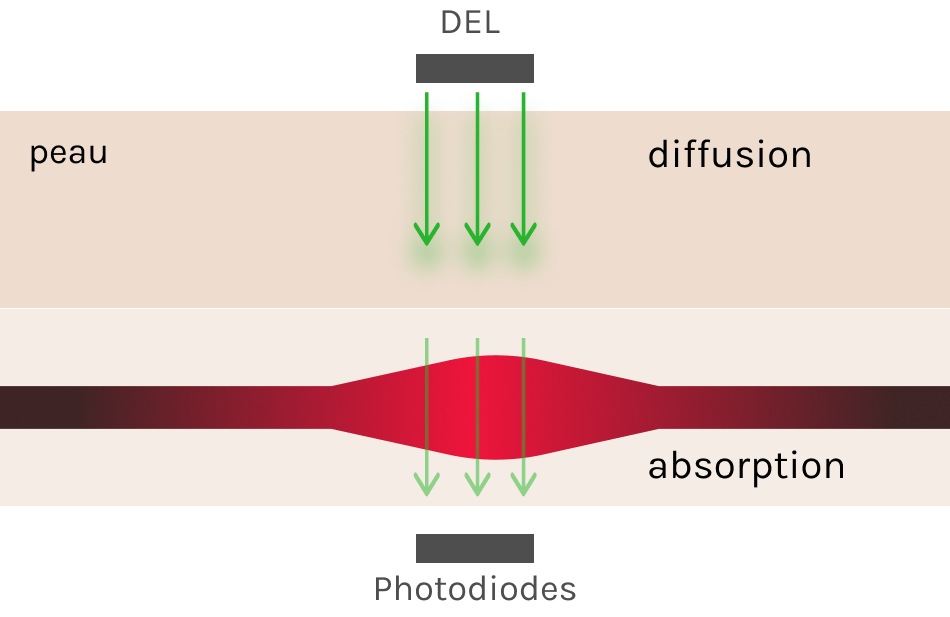
To detect these variations, a LED emitting light in a certain wavelength range is used, along with a photodiode that converts the received light intensity into an electrical signal, also sensitive in a certain wavelength range.
To maximize sensitivity and detect the most significant variations, it is crucial to choose the right wavelength range. Given that blood is mainly composed of hemoglobin and oxyhemoglobin, it is relevant to analyze the absorption spectrum of these components.
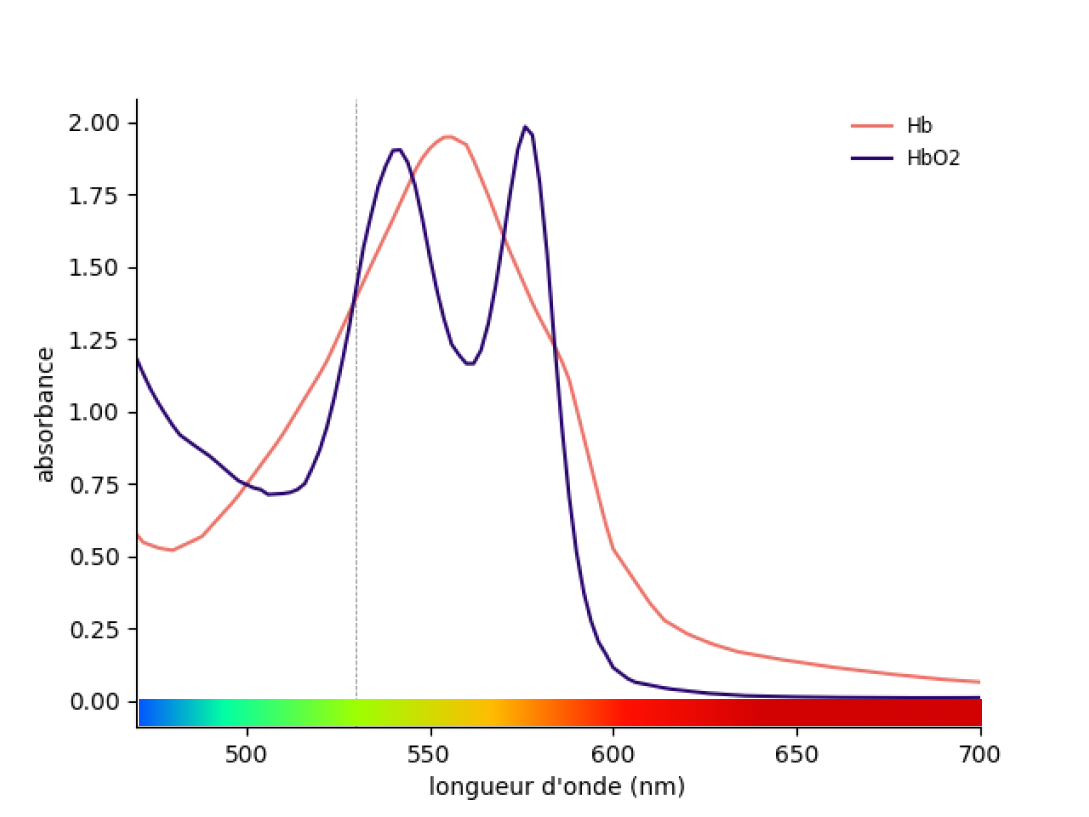
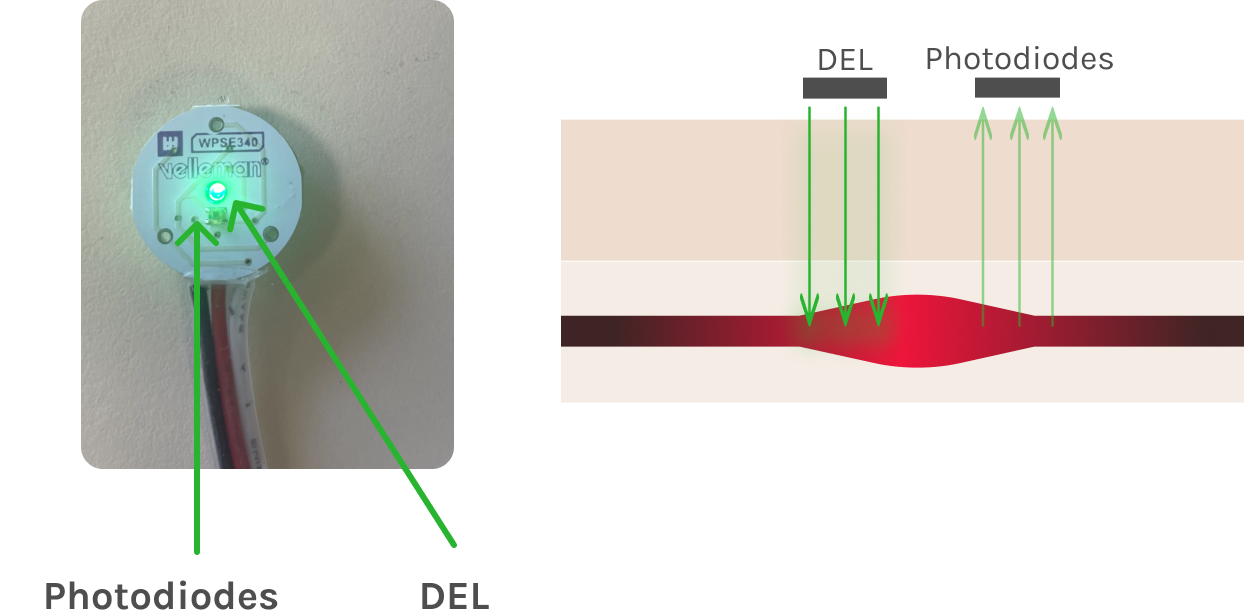
On this graph, we observe that it is relevant to choose a wavelength between 520 and 550 nm, corresponding to the green color. This is why most smartwatches emit green light on their back. In my project, I used a sensor similar to that of a smartwatch, where the LED and photodiode are positioned on the same side, as illustrated in the photo below.
Using an Arduino board, I was able to make a first acquisition by placing the sensor on my wrist. Here is the resulting curve.
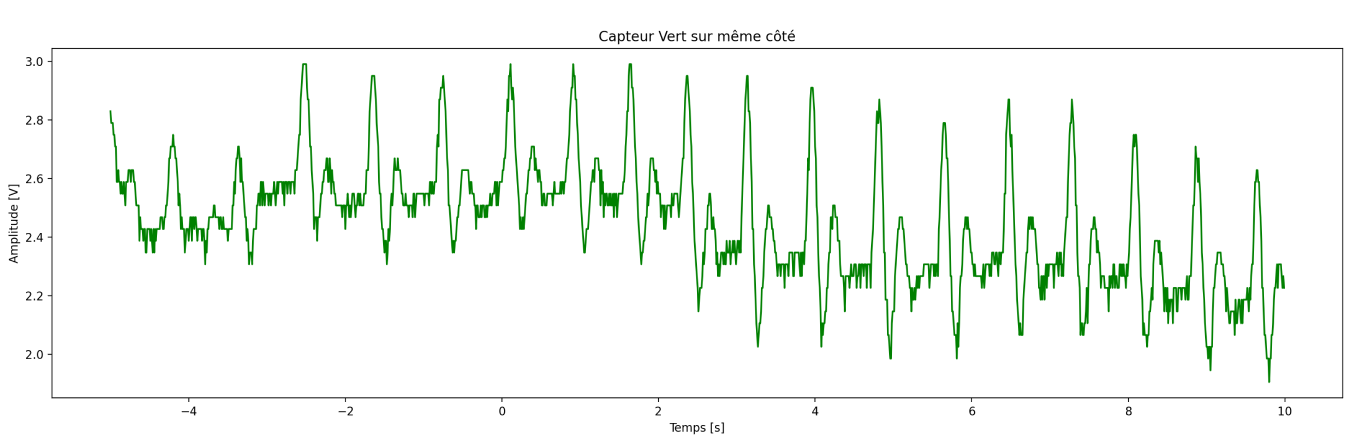
On this curve, we can clearly distinguish the systole and diastole phases, which allows us to deduce the heart rate. For signal processing to obtain beats per minute (bpm), I explored several approaches: the first consists of applying the Fourier transform, while the second relies on peak detection. Let's start by examining the method using the Fourier transform.
First, to avoid spectrum folding, we will apply a first-order low-pass filter to our signal.
def filtreList(L: np.array, tau=0.1, Te=0.01) -> np.array:
    Lfiltre = np.zeros_like(L)
    Lfiltre[0] = L[0]
    for i in range(1, len(L)):
        Lfiltre[i] = Lfiltre[i - 1] + Te / tau * (L[i] - Lfiltre[i - 1])
    return Lfiltre
Then, using NumPy's rfft function, we can calculate the Fourier transform.
yf = rfft(valeurs, N)
# Valeurs absolues de yf
yf = np.abs(yf)
# Création du tableau NumPy contenant les fréquences pour lesquelles
# les amplitudes des fonctions sinusoïdales ont été calculées
M = len(yf)
xf = np.linspace(0, fe / 2, M)
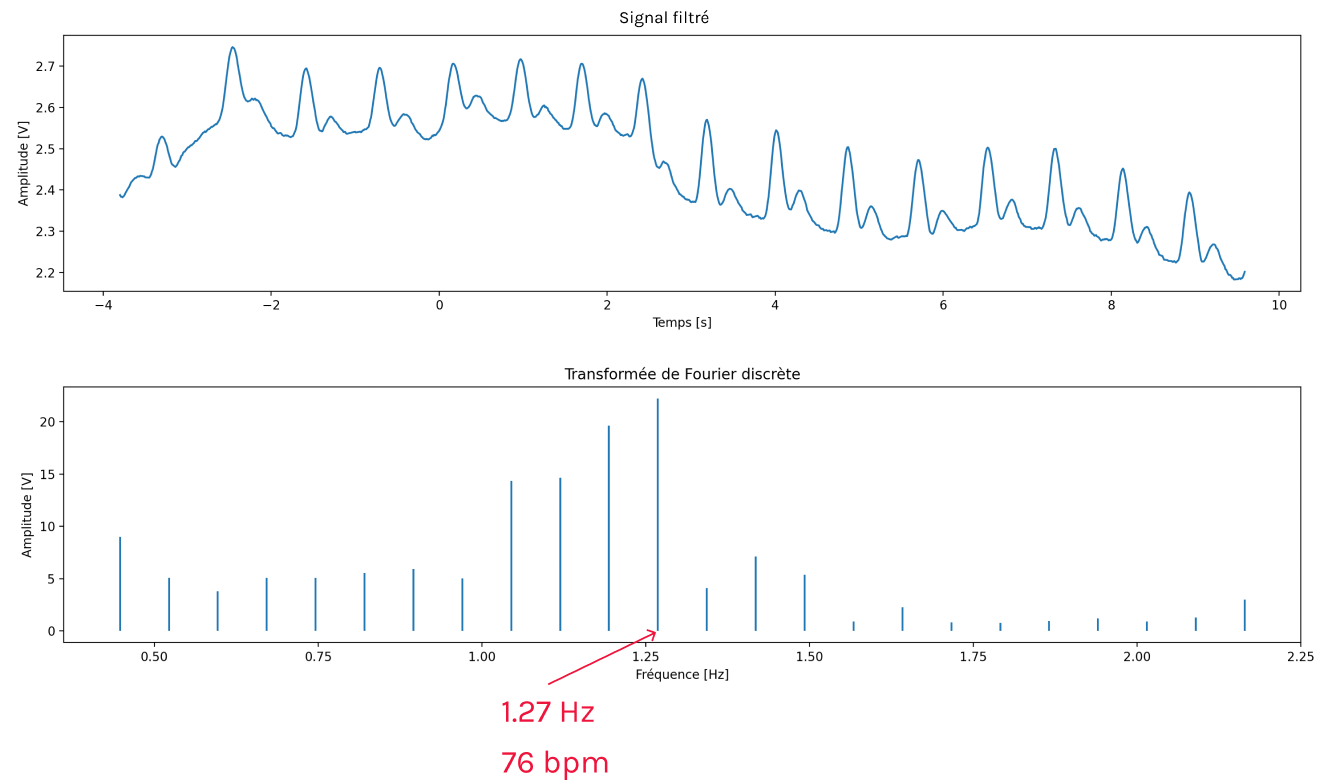
With the Fourier transform, we obtain a heart rate of 76 bpm, which is consistent with expectations.
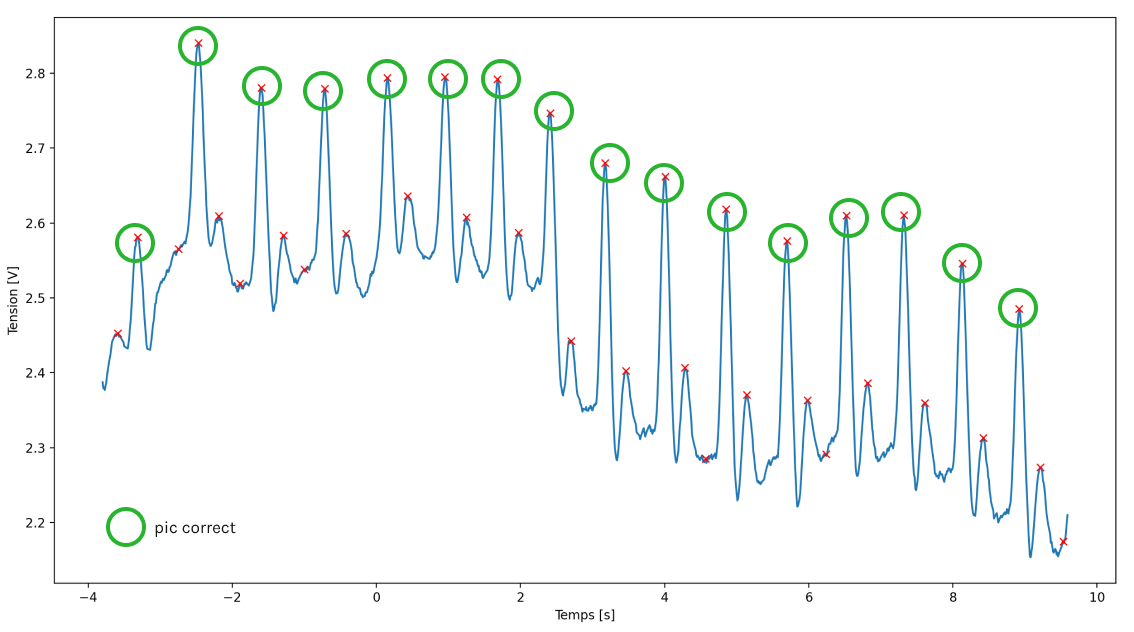
Let's now move on to the peak detection method. The objective of this method is to count the number of peaks during the systole phase in order to calculate the bpm. To do this, I started by filtering the signal, then applied a peak detection algorithm. The resulting graph is presented below.
Simply using an algorithm to detect peaks is not enough, as there are a large number of false positives. So I tried to train a neural network. The objective of this network is to determine for each point whether it is a good point or a false positive. For this, as input to my network, I provide 40 values of the signal before and after the point, for a total of 80 values, which represents a little less than a second.

After manually annotating more than 150 points indicating whether they were false positives or not, I was able to move on to training the neural network using the Scikit-learn library.
X_train, X_test, Y_train, Y_test = train_test_split(X, Y, test_size=0.2)
regression = MLPClassifier(hidden_layer_sizes=(50, 10), activation="relu", solver="adam")
regression.fit(X_train, Y_train)
# Test avec score
print(regression.score(X_test, Y_test))
filename = 'model92.sav'
joblib.dump(regression, filename)
Once the model was trained, I obtained a score of 92%, which indicates that the model is 92% reliable for the data used during the testing phase. I then saved the model weights for later use during the inference phase. Thanks to this model, I obtained the following graph:
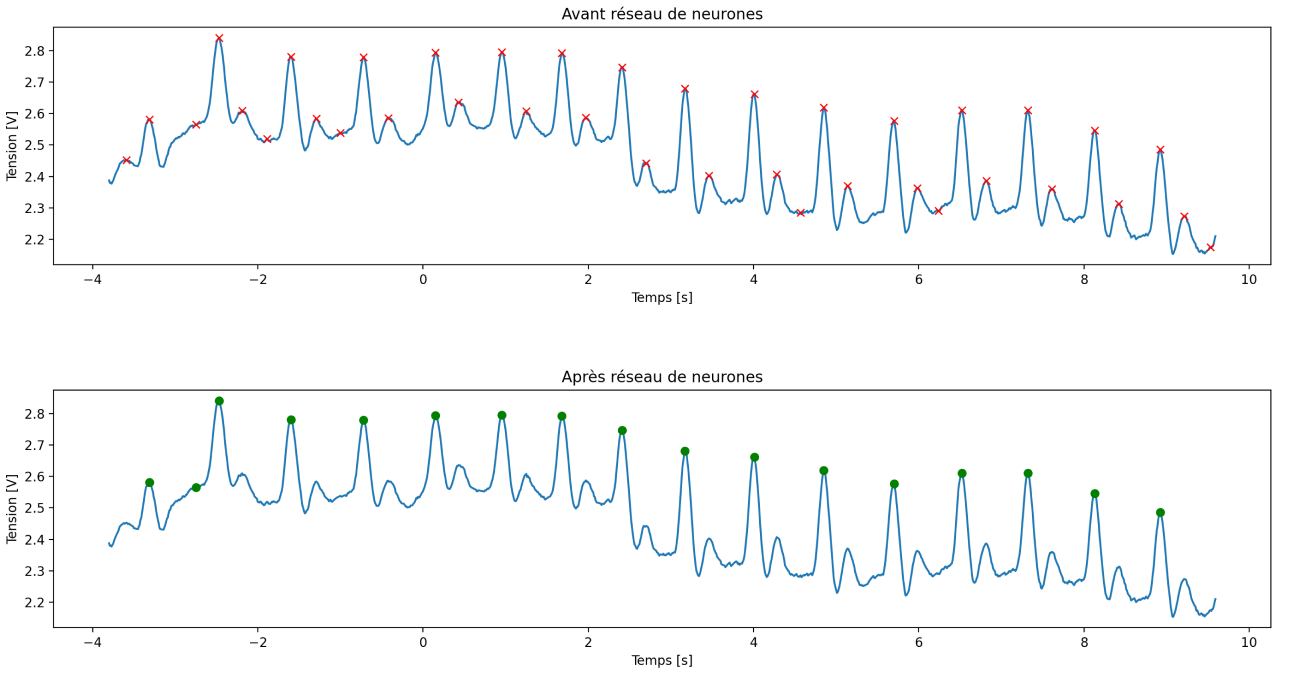
With this method, I also obtained a heart rate of 76 bpm, which confirms the consistency between the two results and their alignment with the real data. However, during my experiments, I identified certain limitations for both methods.
First, the Fourier transform is less sensitive to measurement artifacts and irregular signals, unlike peak detection, which is more likely to make errors in the presence of irregular signals. On the other hand, the Fourier transform may not capture rapid variations in heart rate, as it evaluates the frequency over a longer period. Additionally, the Fourier transform is more complex to implement due to the intensive calculation it requires, unlike the neural network, which is lighter once trained. Furthermore, peak detection can provide a more accurate estimate of instantaneous heart rate.
Now that we have retrieved the heart rate, we can focus on the potential risks that this information helps prevent:
- Cardiac arrhythmias: Abnormal variations in heart rate, such as irregular beats, can be an indicator of arrhythmias.
- Detection of dehydration: A heart rate higher than normal during exercise can signal a state of dehydration.
- Detection of stress or excessive fatigue: Heart rate variability (HRV) is an indicator of the state of the autonomic nervous system and recovery. Low HRV can reveal stress or excessive fatigue.
In conclusion, this project allowed me to explore in depth the techniques of heart rate monitoring and their application in the prevention of various health risks. Through the use of methods such as Fourier transformation and peak detection, as well as the training of a neural network to refine the accuracy of the results, I was able to demonstrate the effectiveness and limitations of these approaches. The results obtained, consistent with real data, underline the importance of selecting methods according to the context of use.
This work highlights the potential of technology to not only monitor, but also anticipate health problems such as cardiac arrhythmias, dehydration, and stress. By mastering these tools, we are paving the way for concrete applications in the field of health, with implications for prevention and individual well-being. This project thus constitutes an important step in my engineering journey, consolidating my skills in signal processing and artificial intelligence, while strengthening my commitment to technological solutions with real impact.